Innovation
Formula 1 trackside aerodynamic analysis explained
by Jack Chilvers
5min read
.webp?cx=0.5&cy=0.5)
Watch the live feed during any given Formula 1 race weekend, and it’s highly likely you’ll see a small group of team members sitting along the pitwall, keenly watching the live telemetry coming in from the car.
.webp?cx=0.5&cy=0.5)
Event, Car, Innovation
Formula 1: The data behind 2025 pre-season F1 testing in Bahrain
What you’re less likely to see is the small army of engineers, both in the garage and back at the factories, watching that same data, including a group of aerodynamicists ensuring the car is behaving as expected.
Tapping into the data
Whilst an F1 car is out on track, engineers monitor a huge array of data points and parameters which are gathered using a myriad of sensors and instrumentations. One of the main tools of the trade that aerodynamicists use to monitor the airflow around the racecar is the pressure tapping.
Pressure tappings are small holes across the aerodynamic surfaces of the car which are connected to pressure transducers by flexible piping. As the airflow passes over the tapping, the static pressure can be measured and transmitted.
Tappings are usually located across areas where higher pressure gradients and suction peaks - where airflow separation occurs - are likely to occur as identified through computational fluid dynamics (CFD) analysis and windtunnel testing.
For example, across the underfloor, tapping points are likely to be clustered around the peak suction regions downstream of the floor leading edge and within the recovery region of the diffuser. Both the front and rear wing elements will also include tappings to monitor their stability throughout the lap.
To help diagnose any on-track issues, the pressure data is usually visualised as a real-time line plot; producing a ‘squiggly’ line that marches forward in time. Any dropouts in aerodynamic load can be quickly identified, it is then up to the engineer to determine the root cause.
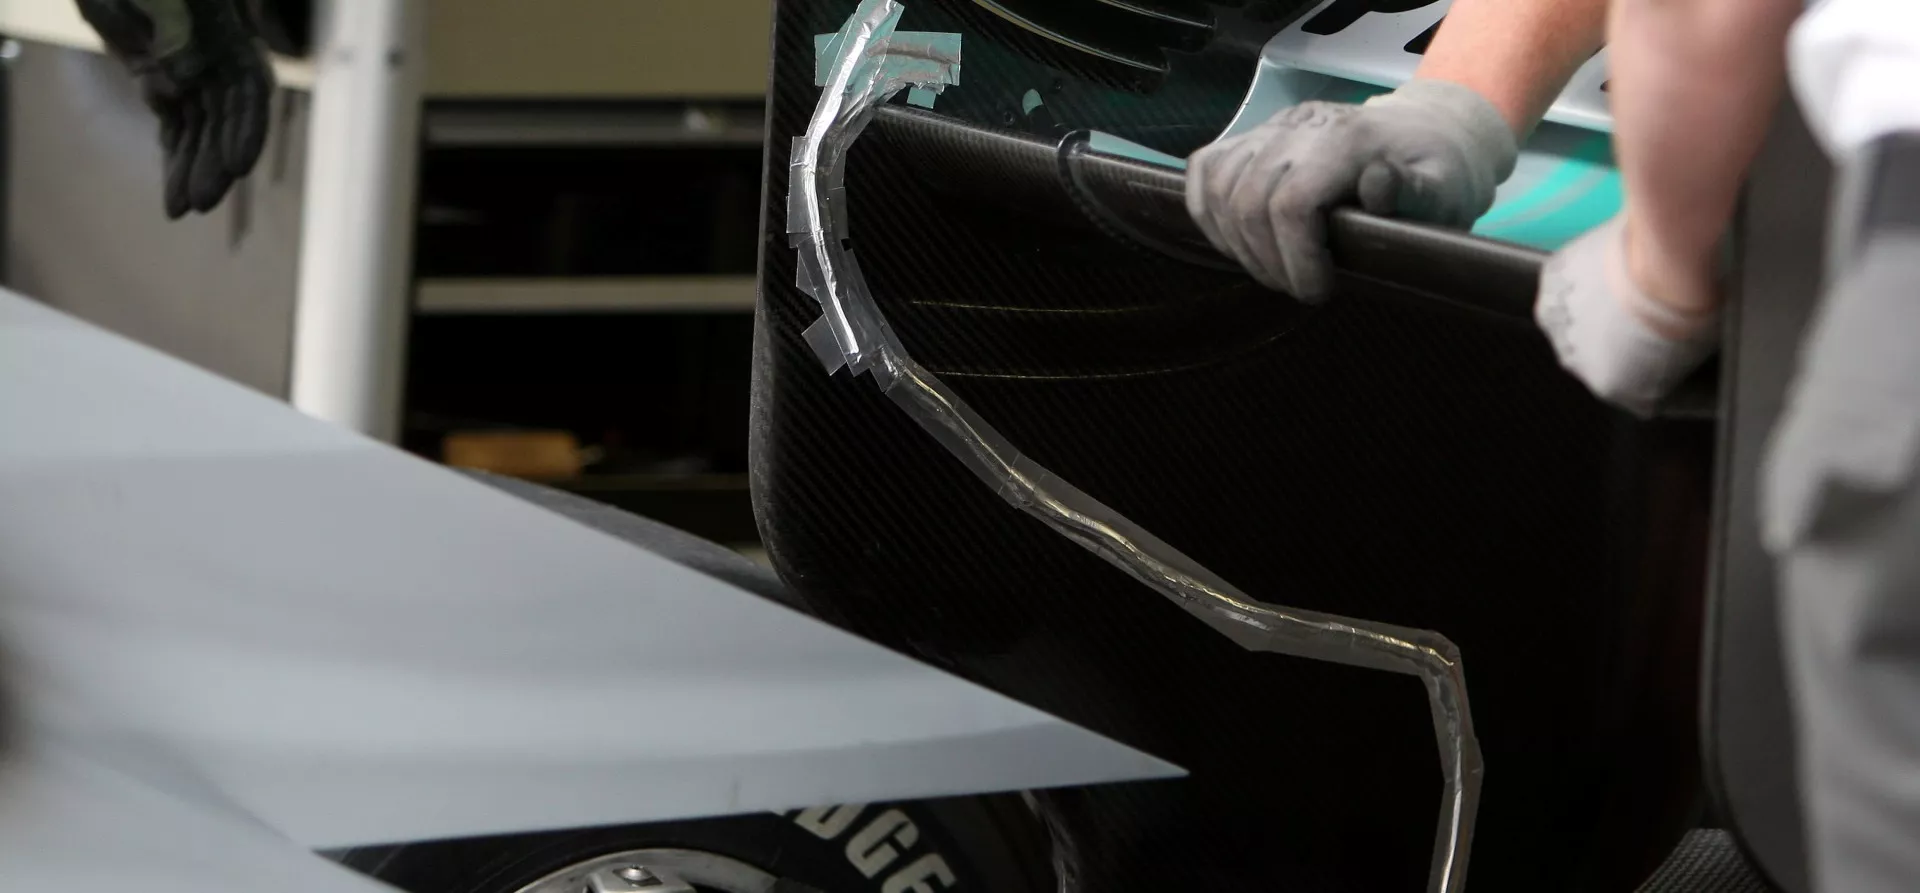
Pressure tapping on the back of Michael Schumacher’s Mercedes F1 car in 2010
Aerodynamic rakes
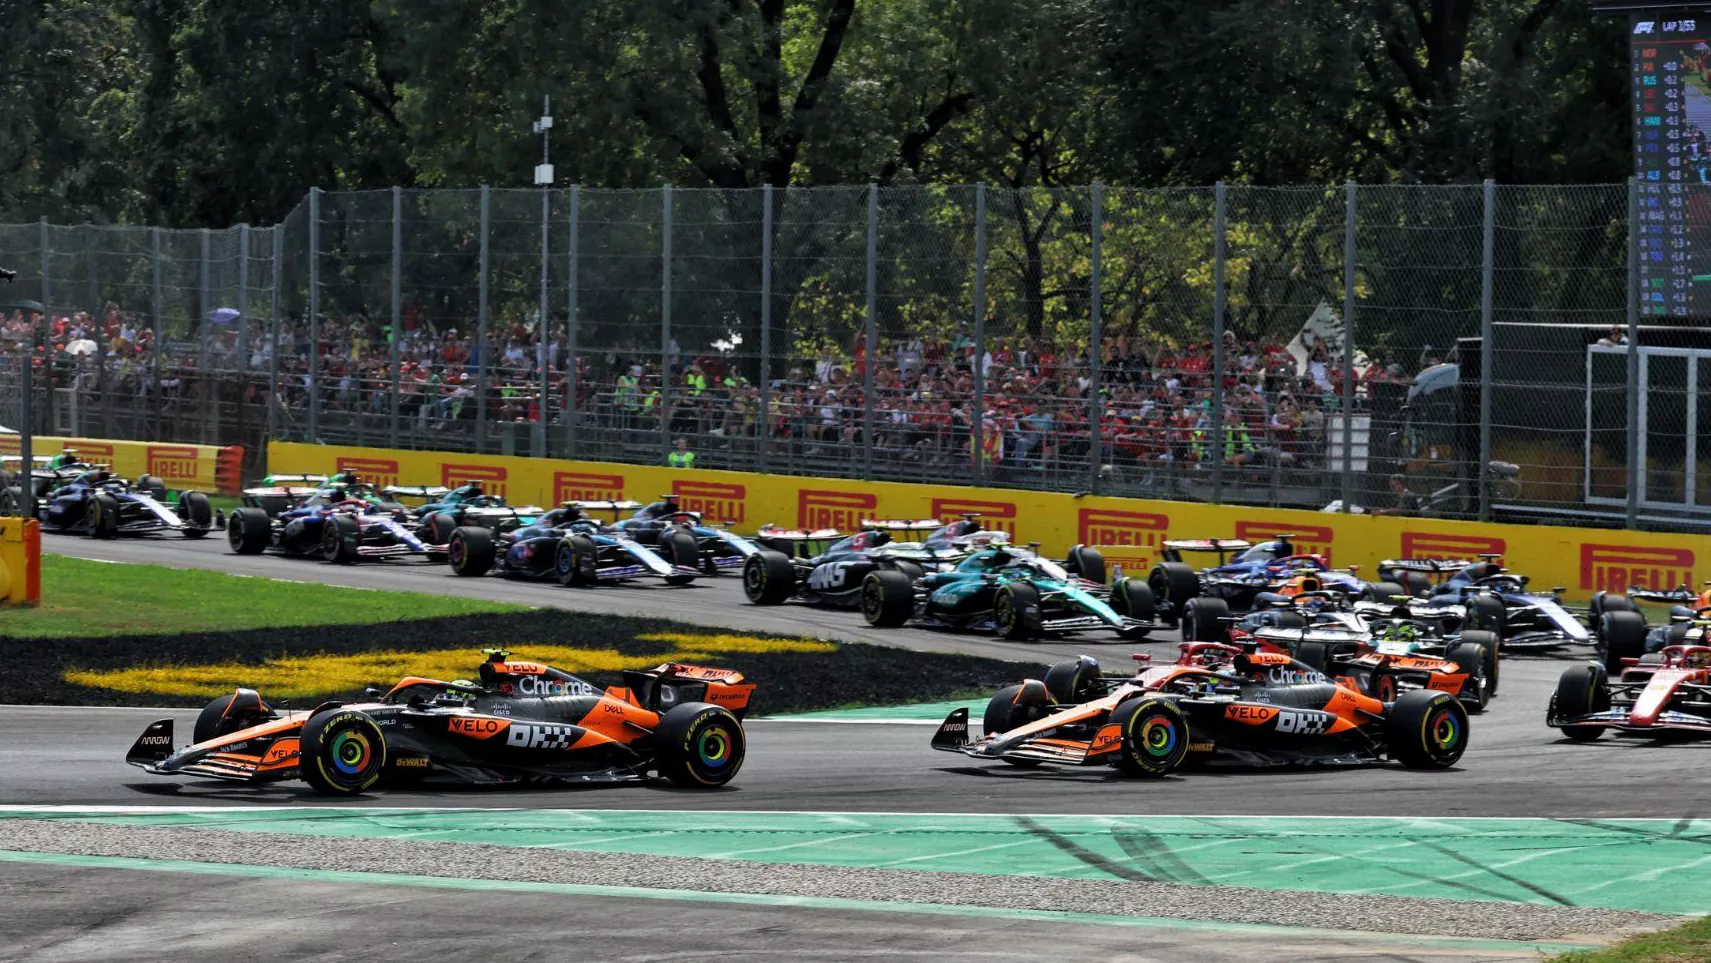
During practice sessions, F1 teams may sometimes elect to run aerodynamic rakes on their cars to gather further data on how the airflow is behaving. Whilst tappings offer insight into on-surface airflow, rakes can provide information into the airflow off the body of the car which can influence its performance.
Looking somewhat like a TV aerial, rakes are metallic frames housing an array of pitot tubes which capture the total pressure at a discrete set of points. Total pressure can be used to visualise regions of losses in the airflow which are often associated with wake structures and vortices being shed from upstream devices. By post-processing this data, contour plots can be generated across a lap showing how airflow structures develop and interact through a variety of cornering and straightline conditions.
Rakes are often used to assess changes in the airflow across configuration changes, from a simple front wing flap angle change to a completely new upgrade package.
.webp?cx=0.5&cy=0.5)
McLaren's Oscar Piastri driving with aero rakes on the front of his F1 car during 2025 preseason testing in Bahrain
.webp?cx=0.5&cy=0.5)
Flow-vis paint
Arguably a much lower-tech - but potentially just as informative - method of visualisation is the use of flow-vis paint across regions of aerodynamic interest. The paint consists of a fluorescent ultraviolet powder which is suspended in a light oil.
Flow-vis is often used on areas such as the front wing, rear wing and diffuser, where stability may be of some concern. The streak patterns left by the air once the paint dries give insight into regions of laminar and turbulent flow, and (more worryingly) where any flow separation has occurred. It can also be useful to show the trajectory of the flow downstream as the paint is transported and propagates across the surface.
Whilst flow-vis offers a relatively simple way of capturing surface flow information, it dries relatively quickly and so must be applied just seconds before the car is making its way out of the garage and down the pit straight. Another disadvantage is that it is incredibly messy and can make its way into every crevice across the bodywork.
.webp?cx=0.5&cy=0.5)
Sauber's F1 car with red flow-vis paint on its right-front side during 2025 pre-season testing
Temperature data
In addition to the external aerodynamics, internal airflow is usually monitored by the aerodynamics group to help determine brake and engine cooling levels. To ensure the brakes can withstand the punishment of a full race distance, they must be adequately cooled to prevent oxidation; accelerated once temperatures go beyond a certain limit. The engine must also be kept within a certain temperature window to ensure optimum performance.
Making sense of the data
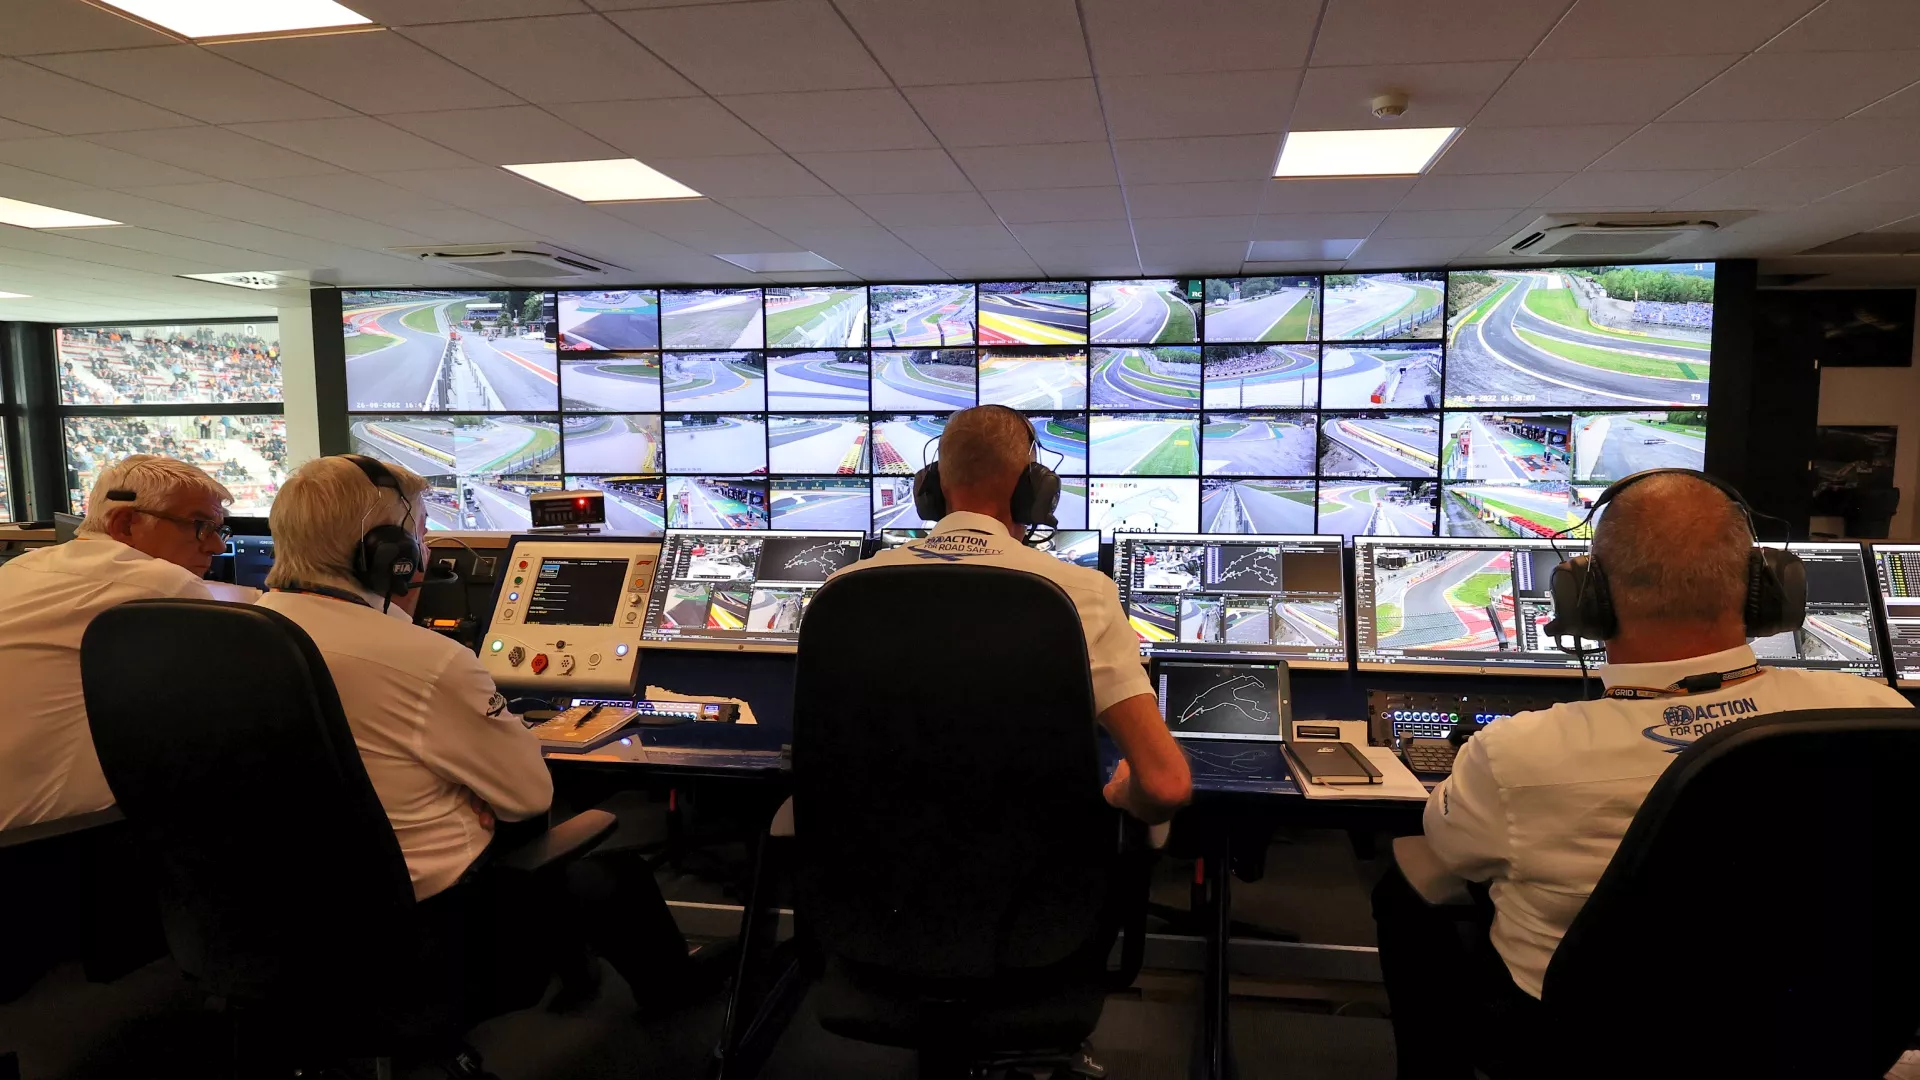
With such a huge onslaught of data coming in live from the racecar as it’s running and the need to potentially make split-second decisions based on any developments, the need to visualise and interpret the raw numbers is critical.
As eluded to previously, one such method is the use of line plots which progress forwards along the x-axis as each subsequent data point comes in. For pressure tappings, these lines tend to bounce up and down as the car yaws and pitches around the circuit.
Overlays with previous laps can highlight any unexpected changes. Any lines which sit around doing nothing can indicate a blocked tapping line or a consistent stalled condition (the former being the preference between the two). Numerical readouts may be more appropriate for more stable data points such as engine oil temperatures which tend to creep up and down.
At the end of the session, when the pressure of making on-the-fly decisions has passed, the data can undergo more rigorous post-processing. Typically, aerodynamics departments will have built their own in-house software to process the raw data.
Static pressure data from across the car can be interpolated across surfaces and used to calculate aerodynamic forces and visualise the pressure map generated. The data may also be clipped into a variety of windows based on the conditions of the onset airflow and car attitude; this can help split out straightline and cornering cases for analysis.
.webp?cx=0.5&cy=0.5)
A Mercedes F1 windtunnel model. Pressure data is collected from the same points of the car trackside as it is in the windtunnel to ensure correlation between the track and factory
Further analysis
Any data gathered during the event can then be fed back into the aerodynamic development workstream. Pressure data is usually gathered at the same positions across the car as on the windtunnel model to allow for a direct comparison across the two environments.
CFD data is also extracted using the same tapping coordinates to close the correlation loop between all three data sets. Scaled rakes are even run in the windtunnel to allow for the data to be compared to track data with representative blockage effects. These correlation exercises are used to further improve the simulation toolsets used by teams to increase the impact of any future upgrades.
Whilst each session during a race weekend is a flurry of activity lasting for no longer than a couple of hours, the data gathered is analysed and dissected from the moment it leaves the car and for many days and even weeks - afterwards to help teams understand and improve their car for the next events.
.webp?cx=0.5&cy=0.5)